


Visualize Your Data. Unlock Your Story.

Your data has a story to tell. When you’re able to see the whole story, it all makes sense

Wyn Enterprise is a business intelligence tool that empowers your users with self-service BI to quickly find important insights within your data and make impactful business decisions. Wyn also helps to save you money with a simple and scalable licensing model.

..
What is your data telling you?

Wyn Enterprise
is Built for Embedded BI

Data is a business’ most valuable resource. With Wyn Enterprise, you can go from data to insights in minutes. Watch the short video to see how Wyn makes this possible!

For whom

Embedded BI for Your Business or Commercial SaaS App

Whether it's your business or your commercial SaaS application, embed Wyn and empower users to explore data, build dashboards, create reports, analyze spreadsheets, generate documents, and share interactive data stories: all from one unified platform.
BI for Software Vendors

Embed BI, advanced analytics, and distributed reporting into any multi-tenant SaaS application with no per-user fees or data limitations.

BI for Your Organization

Empower all end-users to become data-driven. Build a variety of KPIs and dynamic report metrics, all from an embedded business intelligence environment.

Enterprise Licensing

Simple & Scalable
Licensing

You need a scalable business intelligence tool. You also need to know how much it will cost in the long run.

Wyn’s server-based licensing allows room for business growth without an increase in user fees. Server-based licensing allows you to scale your business and the user base — with no additional cost.

No Per-User Fees

Add as many users as needed without worrying about rising costs.

No Data Limitations

Unlimited data handling with seamless performance and no capacity constraints.

Low total cost of ownership

Reduce costs and boost efficiency with our solutions, maximizing your investment.

Empowered Data

Analytics, Spreadsheets & Documents
in One Unified Platform

Explore spreadsheet analytics, build narrative data stories, generate business documents, and ask questions with AI Chat Analysis, all connected to trusted data in Wyn Enterprise.

  • Self-Service BI
  • BI Dashboards
  • BI Reports
  • Spreadsheet Analytics
  • Narrative Data Stories
  • Automated Business Documents
  • AI Chat Analysis

Self-Service BI

Enable users to analyze data without leaving the application they use every day.


  • Self-service BI provides insights for everyone.
  • Saves time, reduces bottlenecks and saves IT resources
  • Explore connected data using formulas, pivot tables, and charts in WynSheets
  • Communicate insights through narrative data stories in Wyn Notebooks
  • Ask business questions using AI Chat Analysis
  • Automate recurring business document creation with WynSmartDocs
  • Improves data literacy and increases team collaboration
  • Create a data-driven culture enabling everyone to be independently data-driven

Interactive BI Dashboards

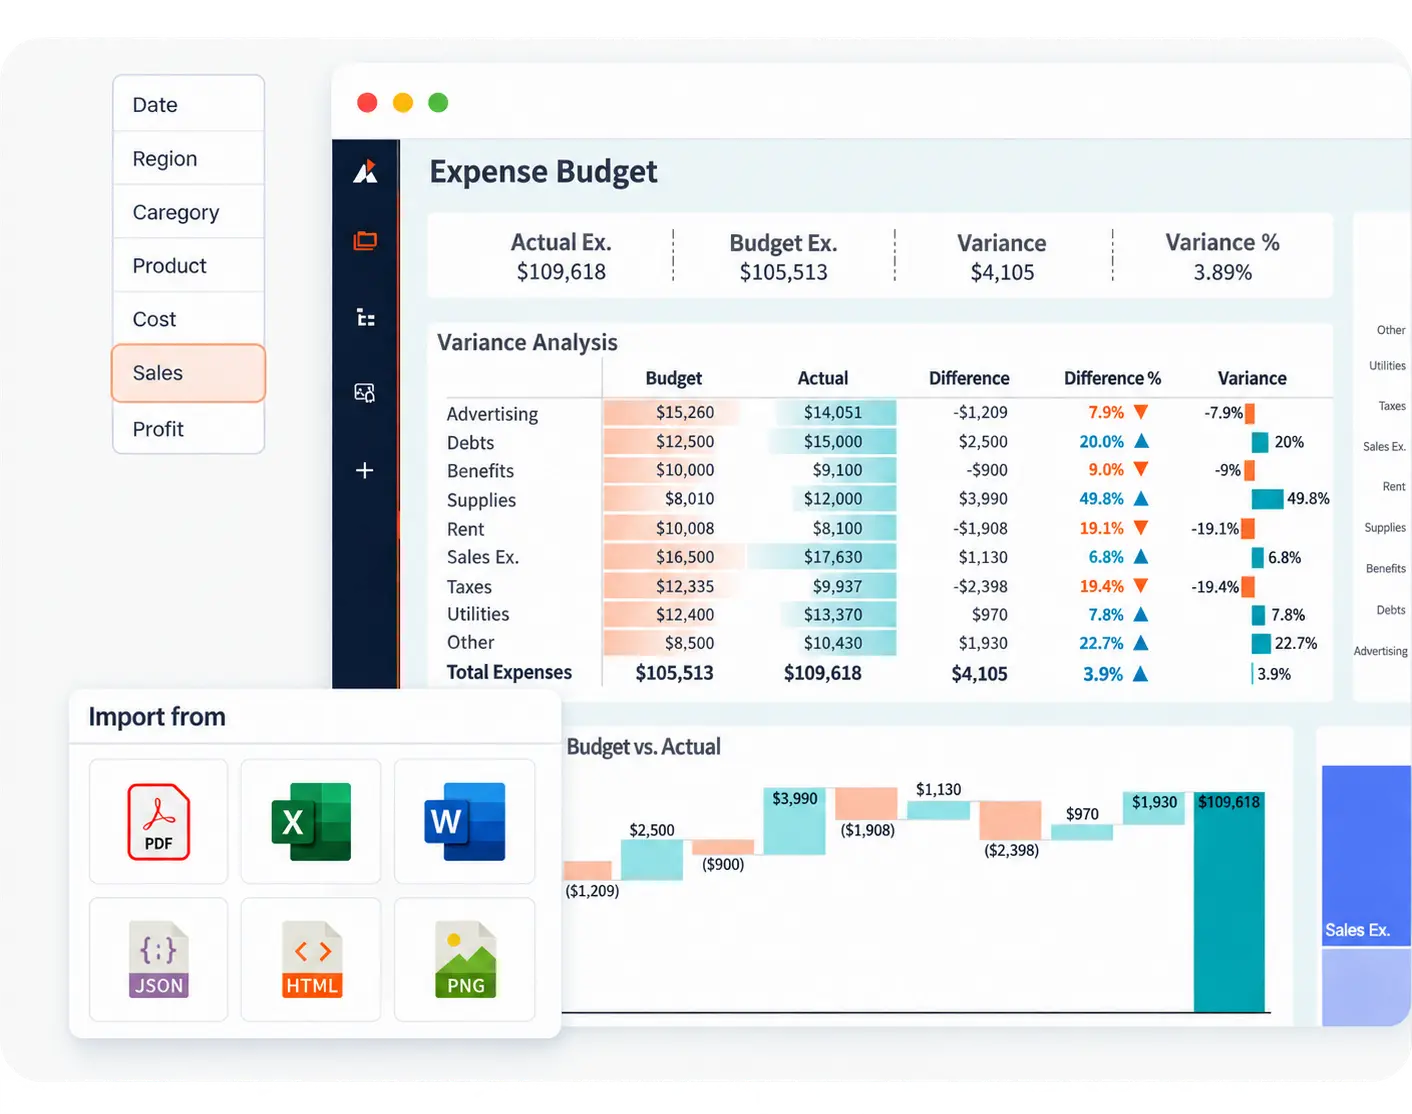
Reveal trends, monitor performance, and turn data into action with AI-powered, interactive dashboards and rich data visualizations.


  • Analyze data with interactive BI dashboards
  • Deliver actionable insights for impactful decisions
  • Monitor KPIs with dynamic filtering, drill-downs, and Wyn Alerts
  • Create ad hoc visualizations
  • Accelerate analysis with InsightIQ
  • Ask business questions and get immediate results  with AI Chat Analysis

End-User BI Reports

Streamline operational and transactional reporting with pixel-perfect reports designed for enterprise distribution, automation, and embedded analytics.


  • User-friendly designer UI to easily prepare reports
  • Create reports from your own branded customized template
  • Automate report distribution with report bursting and scheduled tasks.
  • Embed reports into your applications

Last-Mile Analytics Tool

Combine the flexibility of spreadsheets with the power of governed BI. Analyze live business data without exports or disconnected files.


  • Analyze live BI data in spreadsheets
  • Work with formulas, filters, pivot tables, and charts
  • Explore what-if scenarios and financial models
  • Keep spreadsheet analysis connected to trusted data

Narrative Data Stories

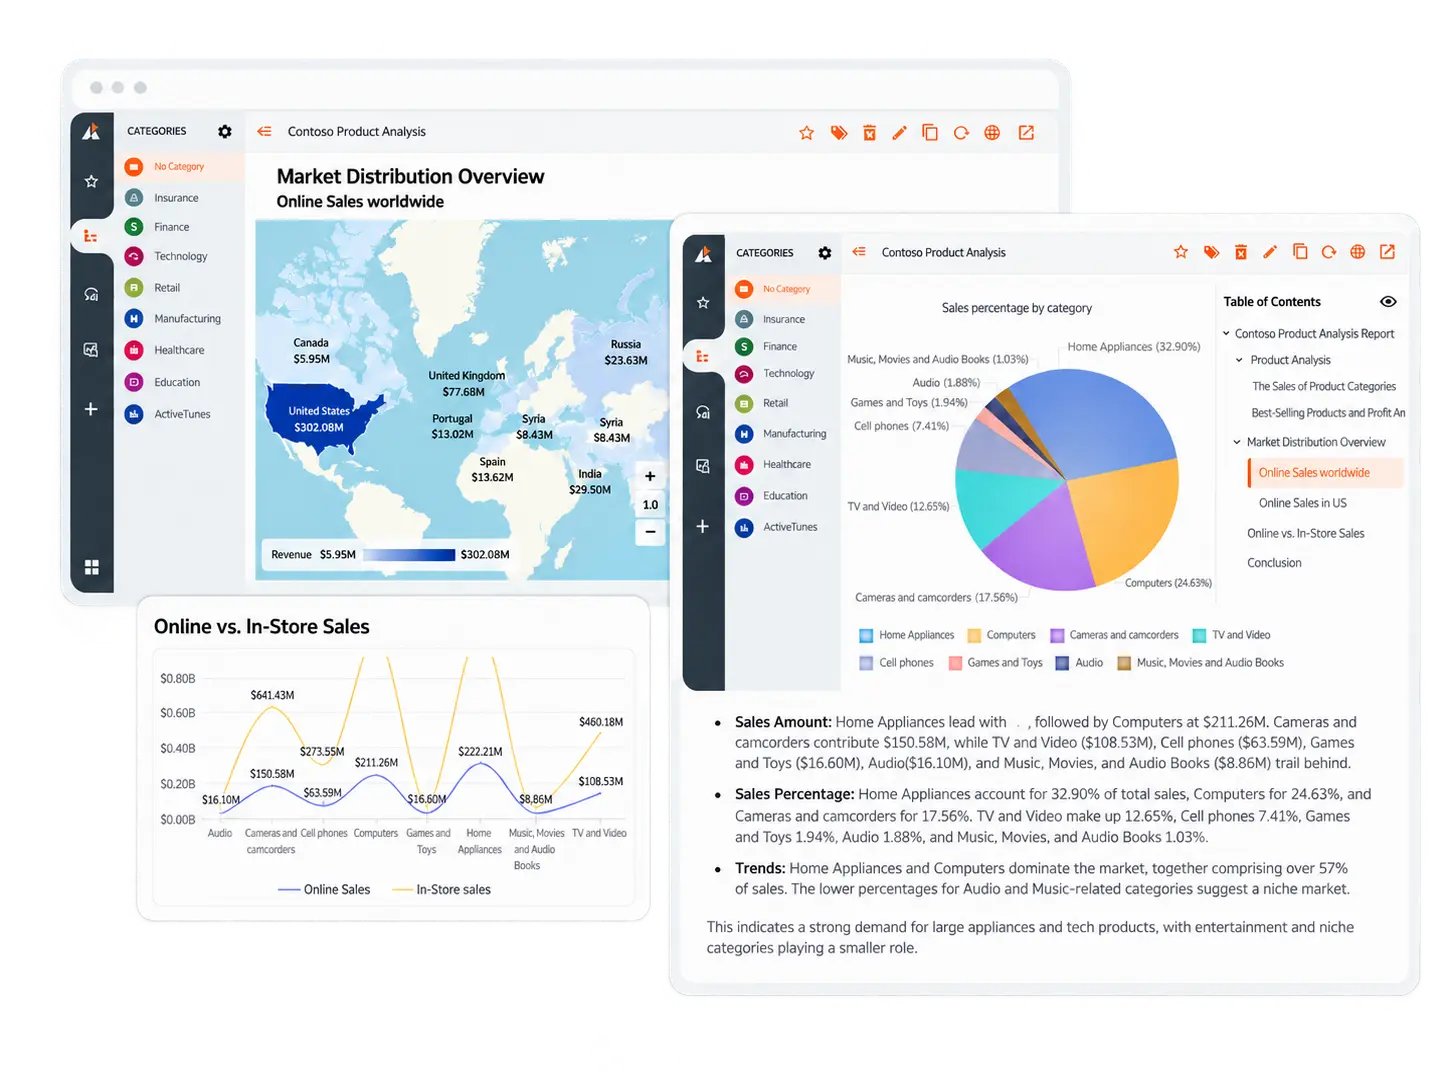
Transform dashboards and data into interactive narratives that explain what happened, why it matters, and what to do next.


  • Combine narrative data stories, charts, and live data
  • Explain insights through interactive analytics
  • Explore governed data with confidence
  • Collaborate in a shared workspace
  • Embed data stories into your applications

New Document Generation for Smarter Workflows

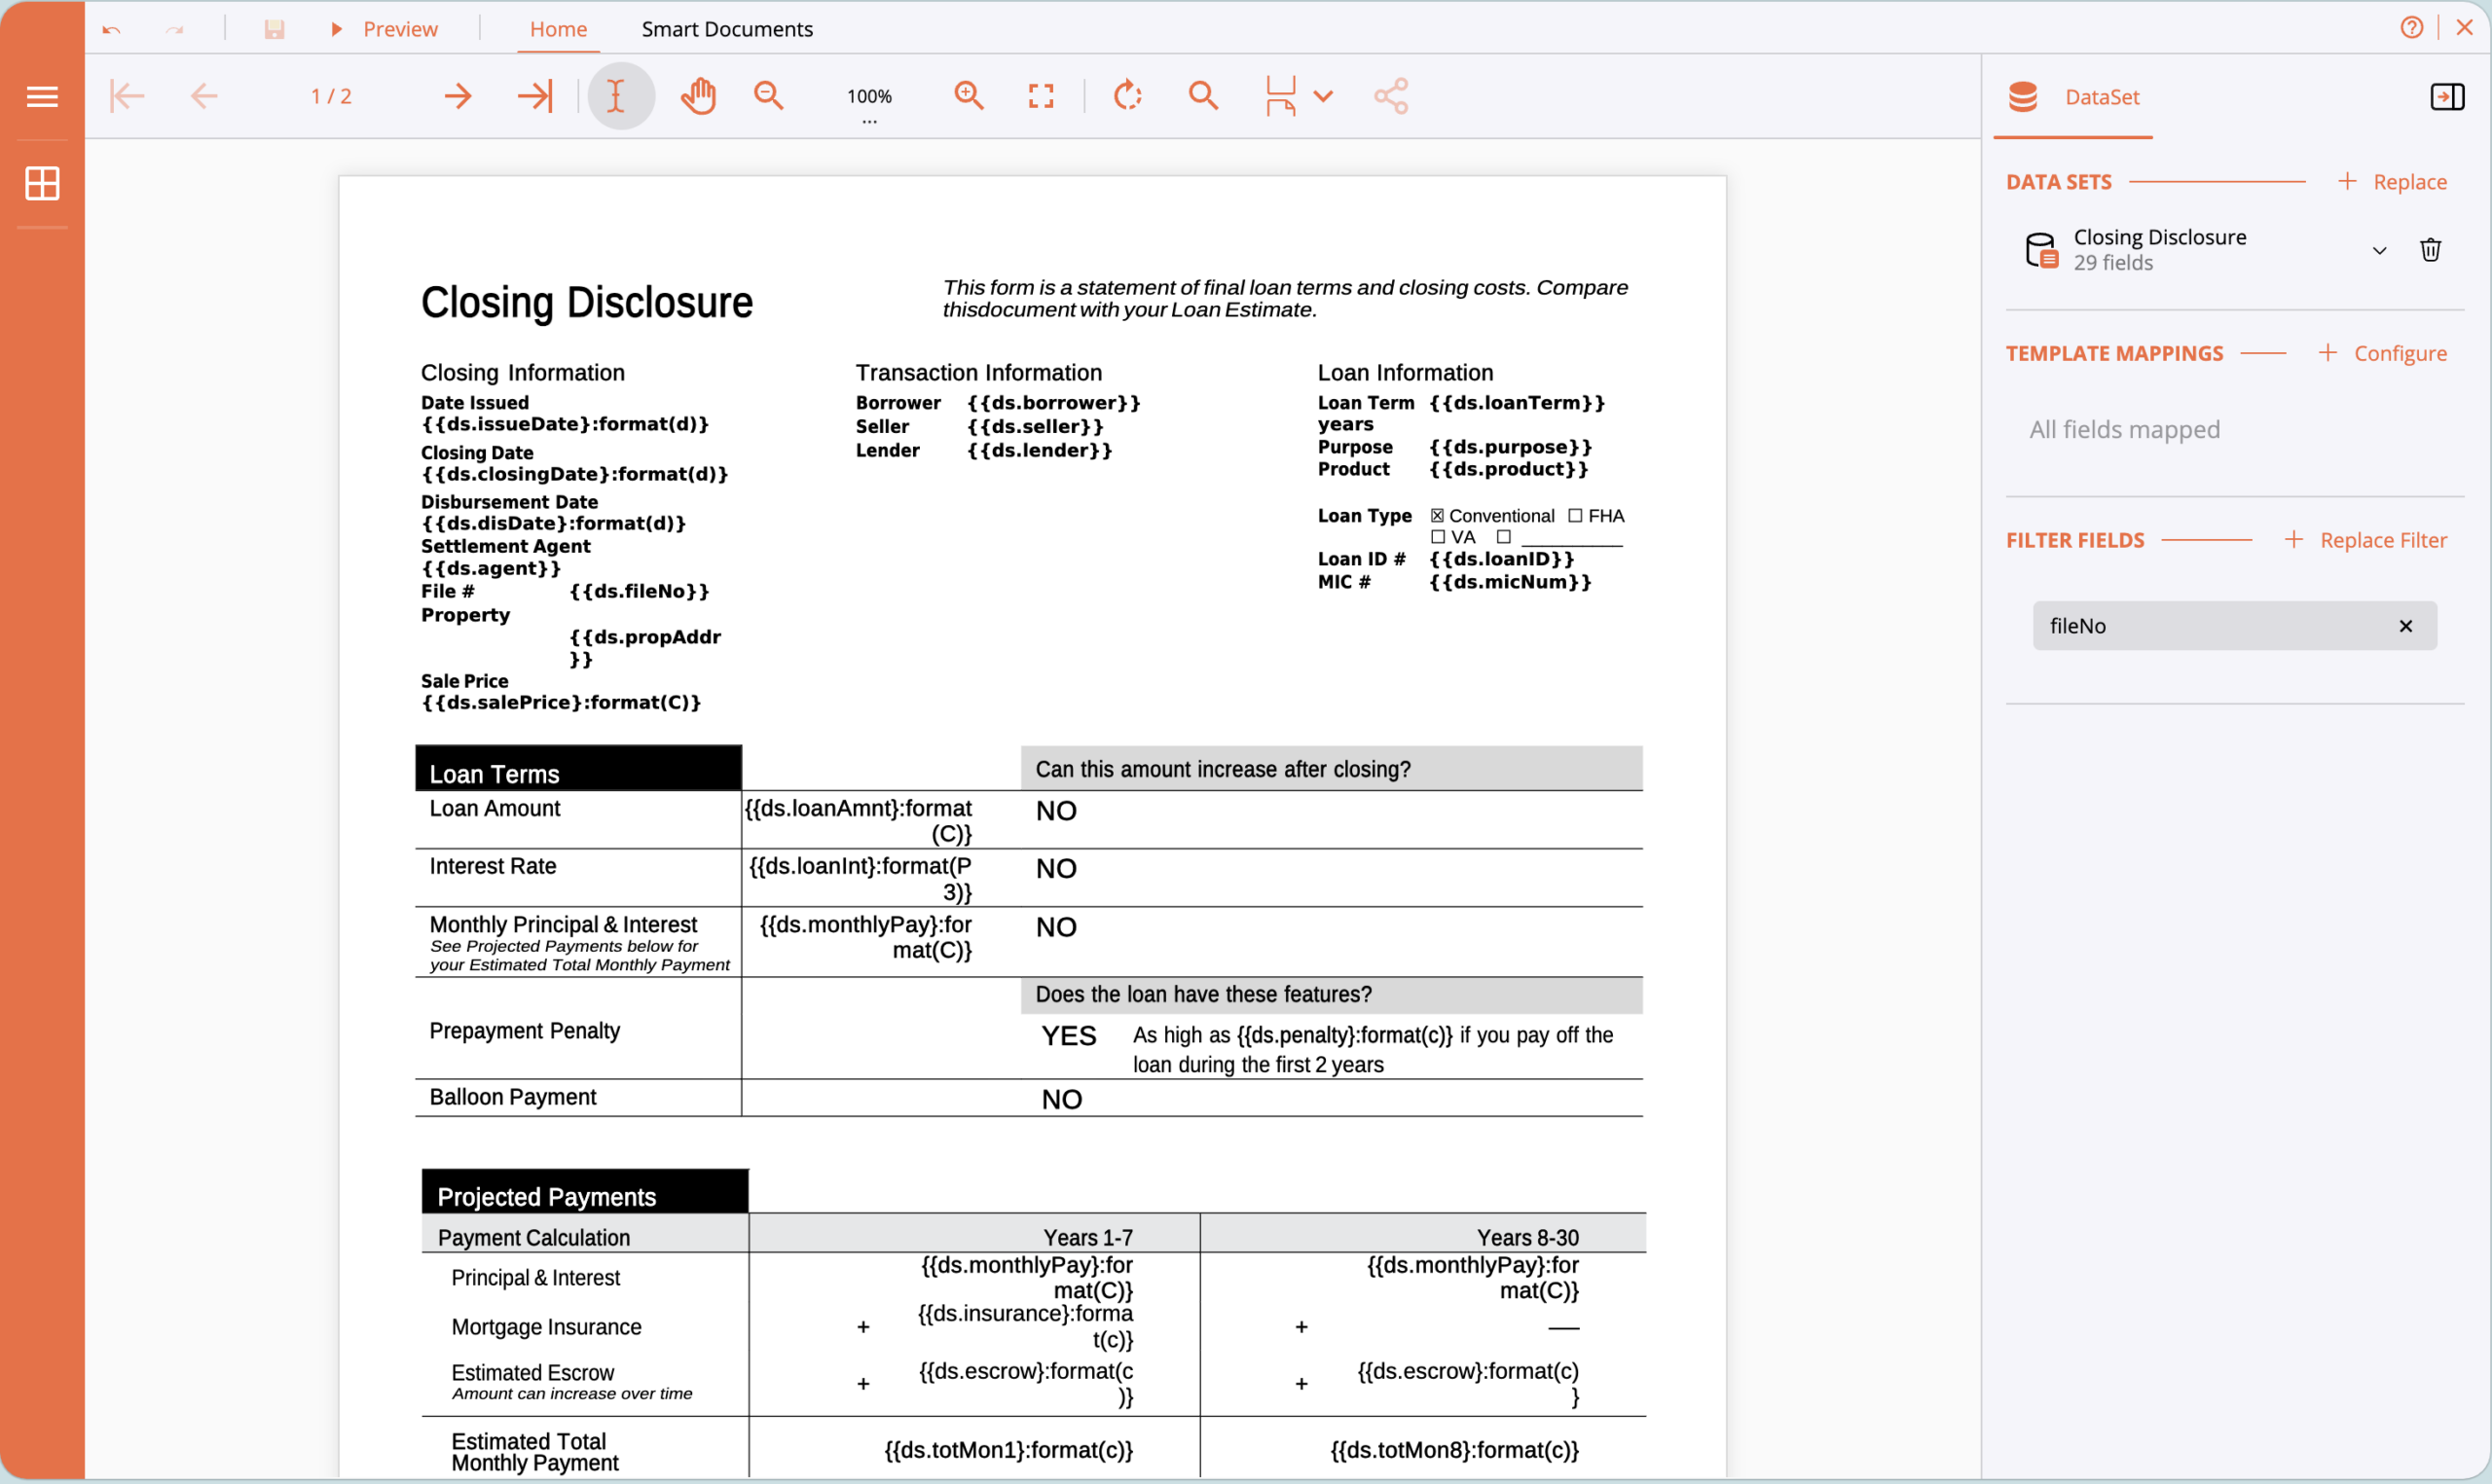
Generate from Word and PDF documents from live business data with intelligent document automation.


  • Generate Smart Document Templates from Word and PDF files
  • Create personalized invoices, contracts, and reports
  • Automate repetitive document workflows
  • Populate documents with live business data
  • Ensure consistent, accurate output every time

Conversational Analytics

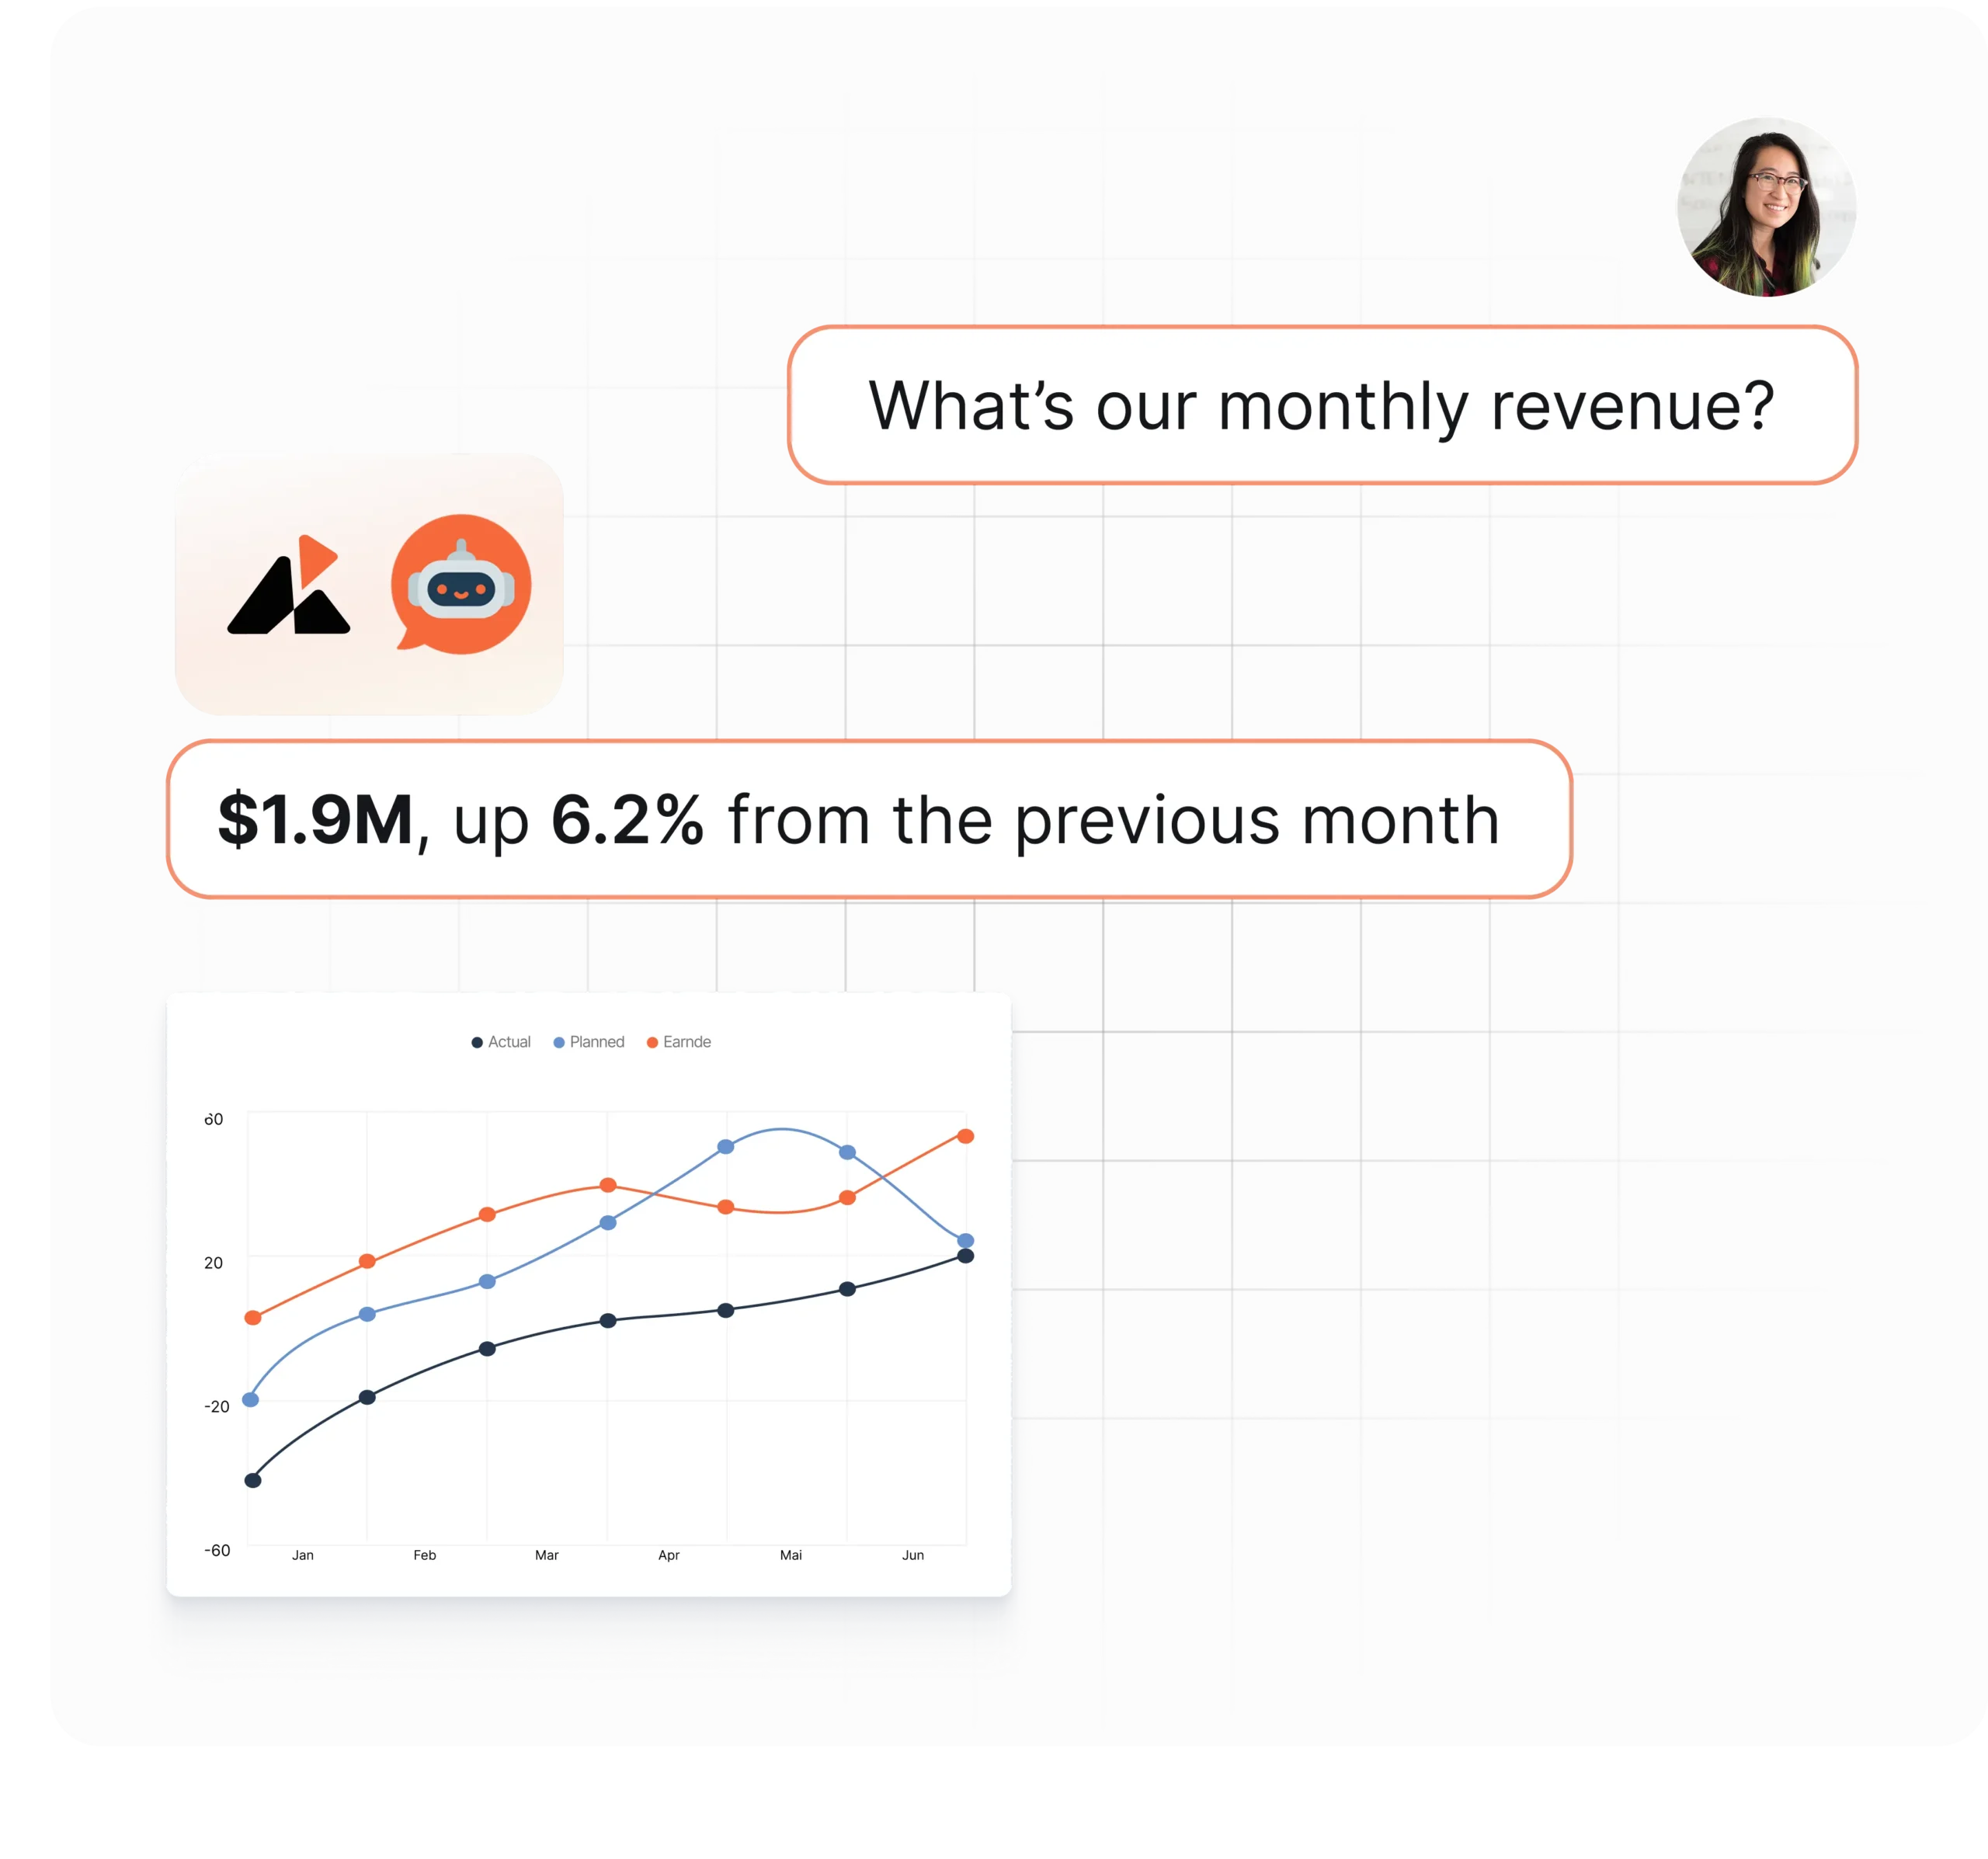
Accelerate analysis with AI-powered tools that help users explore data, uncover insights, and make informed decisions faster.


  • Ask questions in natural language
  • Generate AI-powered data insights
  • Summarize trends and key findings
  • Build dashboards with AI assistance
  • Analyze data with embedded AI Chat

Ready to Learn More?

Request a demo with one of our embedded BI experts or get a free trial.
social proofs

Loved by industry
experts and real users

Go beyond embedded dashboards. Bring the full power of Wyn Enterprise, including reports, spreadsheet analytics, intelligent documents, and data stories directly into your applications.
Testimonials

Don’t take our word for it.
See what our customers have to say.

“Wyn is a great tool with an awesome support team.”
Wyn has been a game-changing addition to our tech stack. It has enabled us to save a massive amount of time for our engineering team by pushing more of the workload to BI-focused team members such as myself, and has allowed us to create new deliverables for clients at a speed that is unmatched.
Charles B.
President, Small-Business
“Writing reports are easy to use as well as very flexible to meet customers' needs.”
Love the flexibility of creating reports from simple to very complicated. I have yet to find something that Wyn Enterprise hasn't been able to support. We also use Wyn Enterprise for a lot of our internal documents as well that are on a monthly scheduler to automatically execute.
Dwane B.
Business Analyst, Enterprise Business
“Remarkably simple yet very powerful”
Simple to install and deploy, great customer support and service. And support team have been AWSOME, always quick to answer a question or get you the resources you need to make your project a success.
Stephen J.
Director IT, Small-Business
“Great reporting platform and support team”
The reporting platform continues to evolve and keep up with changes in technology; the support team is solid and responds quickly, and the product team listens and responds to feedback and product needs. Our software solution requires a flexible reporting platform that allows users to run canned reports and build their own and this is a pretty good fit.
Ian P.
Product Development, Small-Business
Our Blog

Explore our latest product!
features and updates.

See Wyn Enterprise in action

Get a personalized demo to discover how composable analytics can drive strategic business growth. We'll explore how our platform can help you make data-driven decisions, improve customer experiences, and gain a competitive advantage.!!
faqs

Frequently Asked Questions

What are the advantages of using BI dashboards?
  1. Interactive dashboards provide intuitive data presentation, allowing users to understand the story behind their data.
  2. Dashboards visualize all aspects of your business providing actionable insights.
  3. You can drill into detail and zero in on KPI data points.
  4. Dashboards offer an up-to-date view of how the organization is performing.
  5. Identify problems and opportunities to discover what is driving the data.
  6. Modern BI dashboards are interactive and allow customization with ad-hoc visualizations and trend identifications.
How can I reduce BI platform costs?

You can lower your total cost of ownership (TCO) with Wyn Enterprise because Wyn is licensed on a per-server basis. This means that there no per-user fees and no run-time royalties. You can scale and add users without worrying about an increase in licensing fees. From a Wyn-licensed server, you can launch an unlimited number of applications to an unlimited number of end-users for a FLAT FEE.

Are Wyn's BI dashboard designers easy to use?

Yes. Wyn’s dashboard and report designers are highly intuitive, utilizing simple drag-and-drop interactivity. The Wyn platform is highly customizable, so system admins can hide complex controls from less-technical business users while allowing access to all the “bells and whistles” to their power users. The ability to hide complex functionality from less-technical end-users helps lower an organization’s learning curve.

Can I embed Wyn Enterprise modules in my commercial application?

Yes, Wyn Enterprise modules are specifically designed for seamless integration into your commercial application. Our embedded BI platform empowers software vendors and SaaS providers to enhance their offerings by embedding interactive dashboards, pixel-perfect reports, and advanced analytics directly into their solutions. With our flexible SDKs, APIs, and customizable components, you can quickly deploy and scale without additional per-user fees, driving value and engagement for your customers.

What is self-service in BI?

Self-service in business intelligence empowers business users to access data, perform analysis, and generate insights without relying on IT teams. By leveraging self service business intelligence platforms, organizations enable teams to explore enterprise data on their own, speeding up decision-making and fostering a data-driven culture. With self-service analytics capabilities, team members can build reports, customize visualizations, and uncover trends independently. The benefits of self-service analytics include reduced reliance on specialized data analysts, faster time to insights, and greater agility in responding to market changes among others.

What is the purpose of dashboard reporting?

Dashboard reporting brings critical metrics and business KPIs into a single, visual interface designed for quick interpretation highlighting actionable insights. Effective dashboard design ensures that stakeholders immediately see key performance indicators without digging through spreadsheets or complex databases and analytic models. Top dashboards software solutions allow users to monitor real-time data, track goals, and spot anomalies at a glance. By prioritizing intuitive dashboard design, organizations can improve collaboration, streamline communication, and drive better business outcomes.

What is an embedded reporting tool?

An embedded reporting tool seamlessly integrates data reporting functions directly into existing applications, portals, or websites. Unlike standalone systems, embedded BI tools let users access reports and visualizations without leaving their day-to-day workflows. These tools transform business reporting systems by delivering contextual insights exactly where decisions are made, whether that’s within a CRM, ERP, or custom web portal. With embedded reporting, organizations achieve deeper adoption of analytics and ensure that data stays front-and-center for every user.

What is an enterprise reporting system?

An enterprise reporting system provides a scalable, centralized platform to create dashboards and reports that serve large, distributed, and global teams. By bringing together data sources into a unified environment with data governance rules, enterprise reporting solutions enable leadership to maintain consistent metrics and data literacy across the entire organization. Beyond simply building reports, these systems support automated scheduling, advanced security controls, and versioned report templates, ensuring accuracy and compliance. Whether you’re building reports for executive review or operational monitoring, an enterprise reporting system simplifies distribution and helps drive strategic growth.