Platform
-
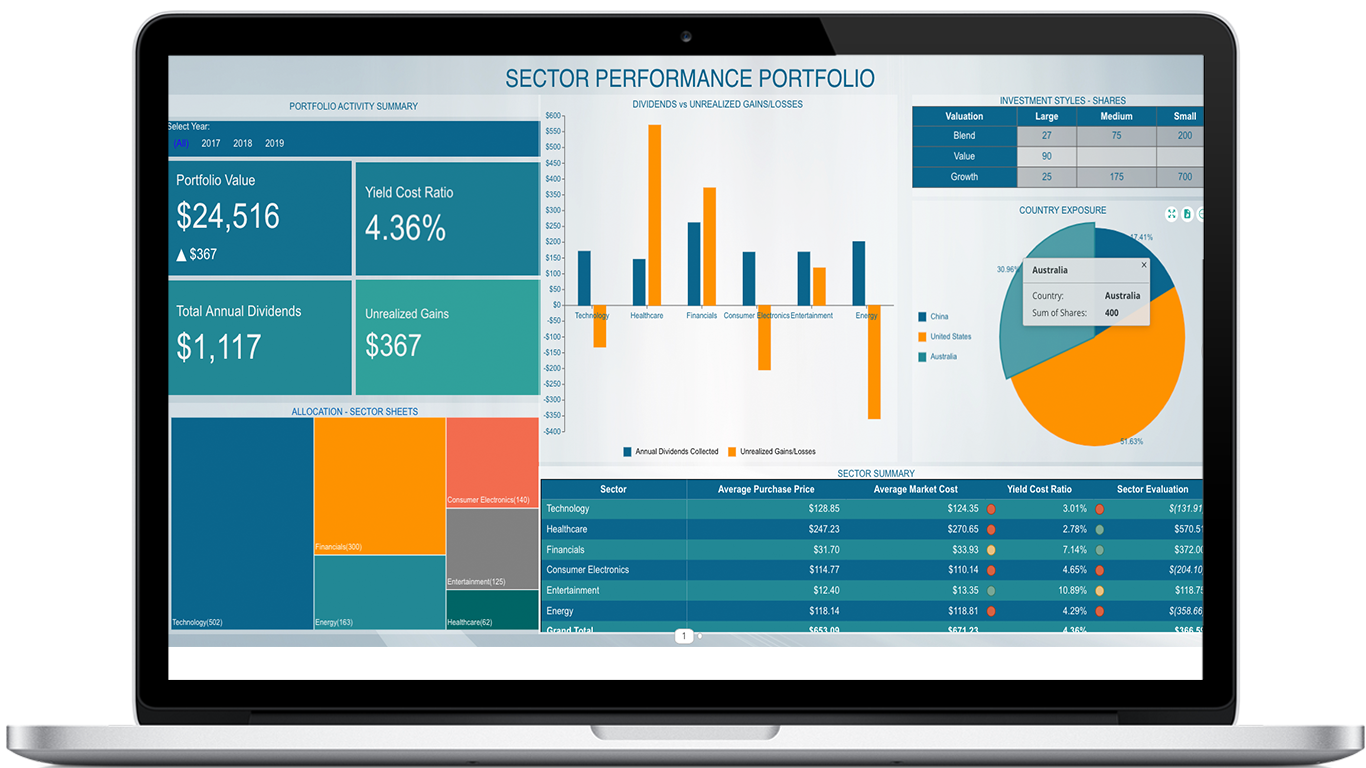
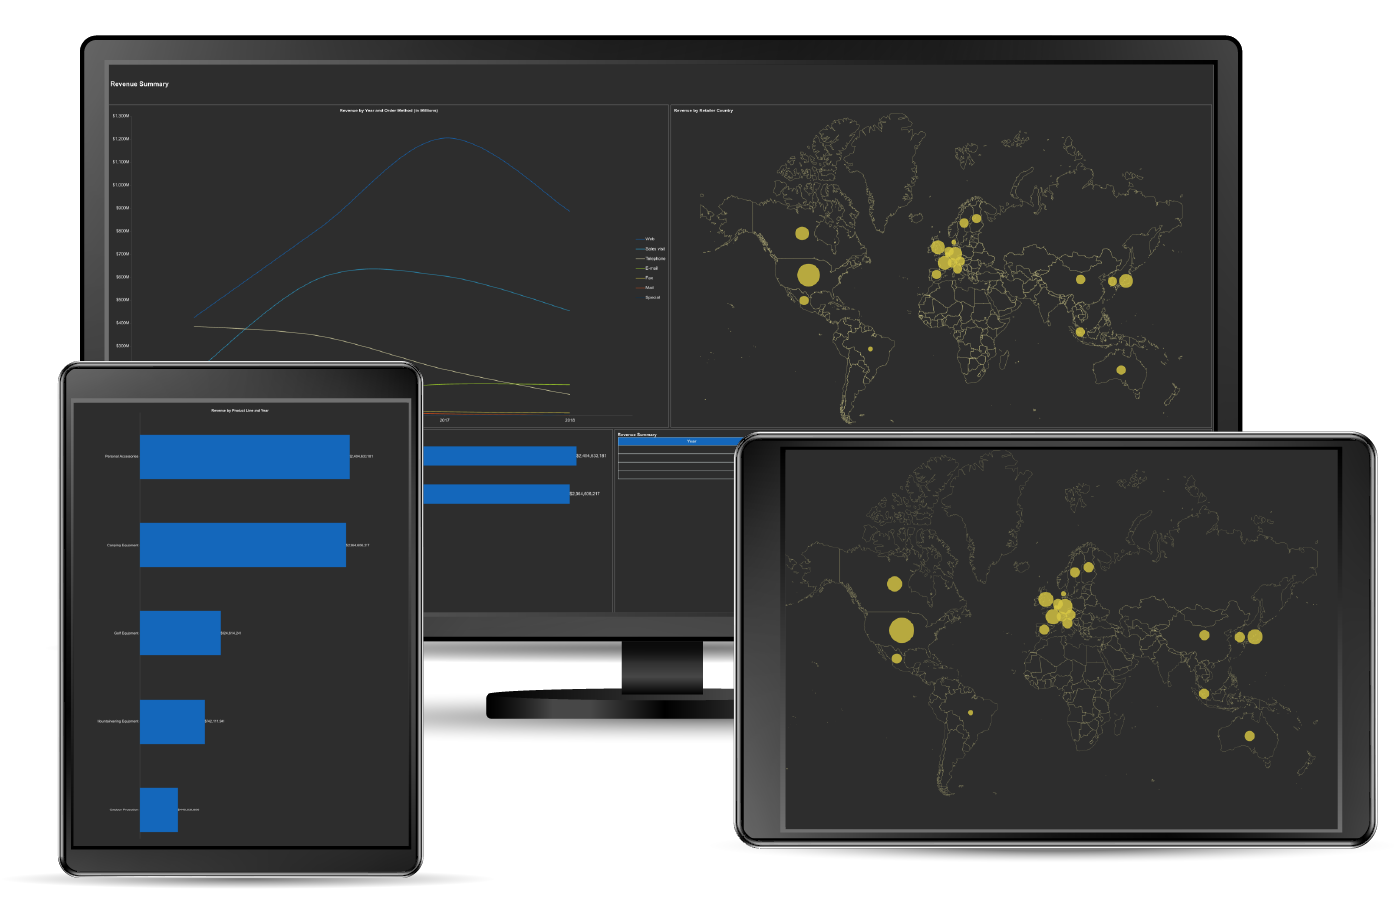
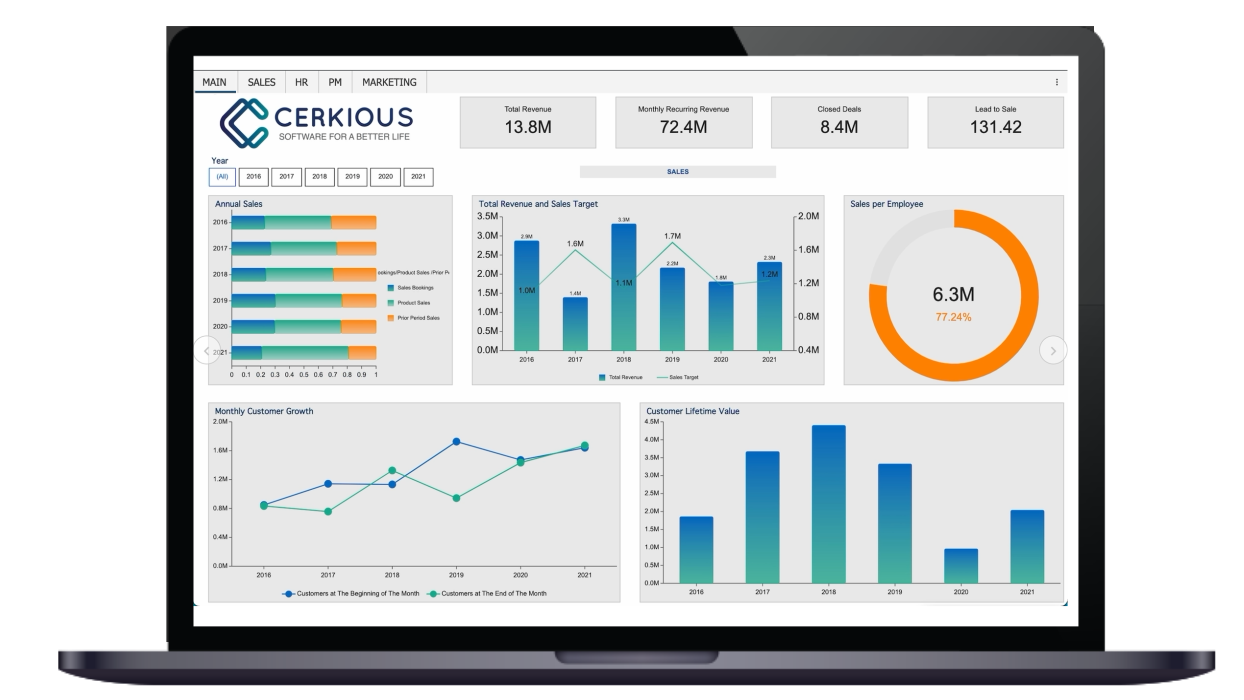
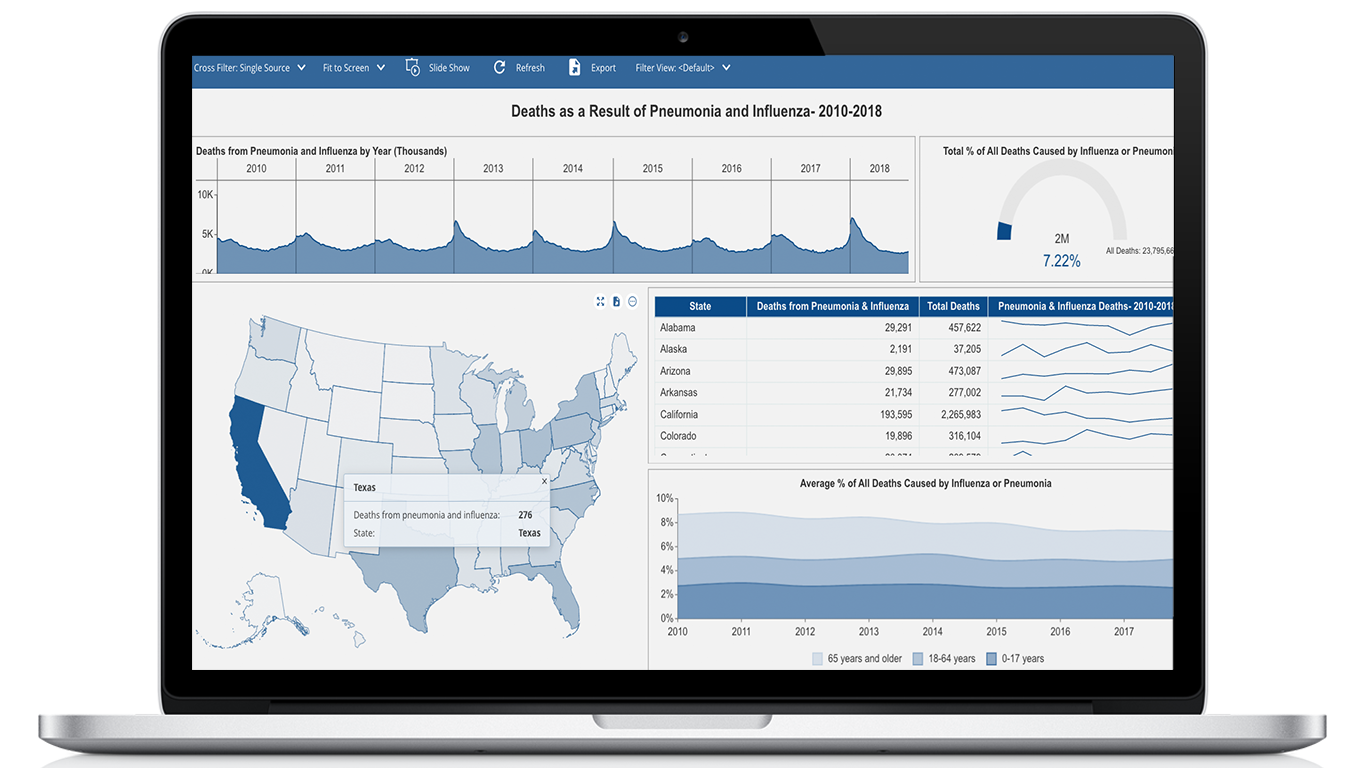
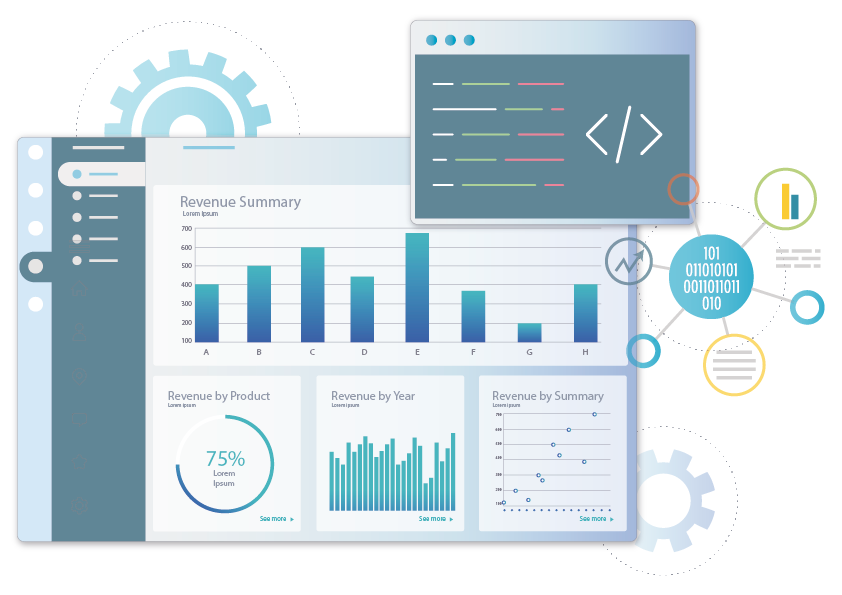
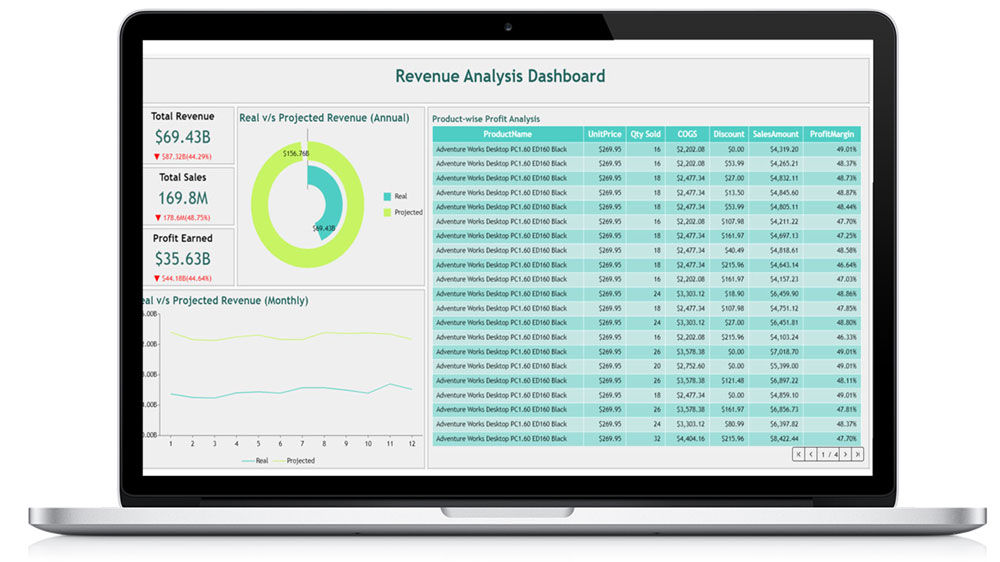
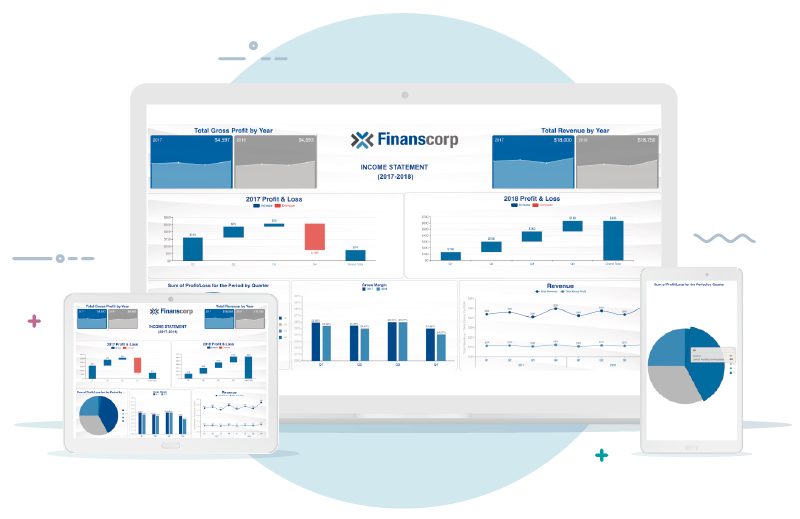
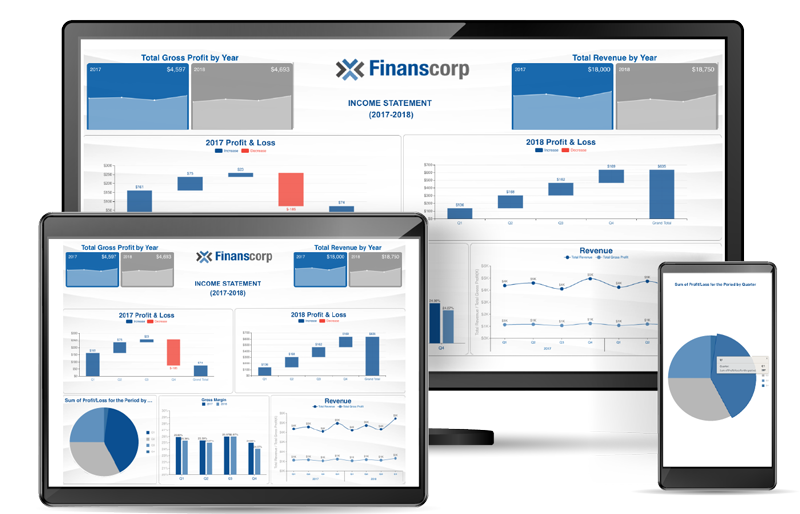
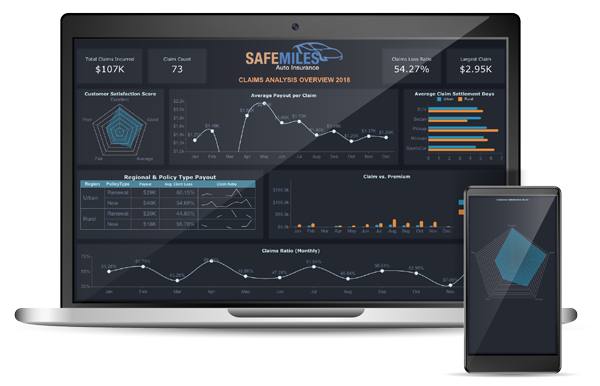
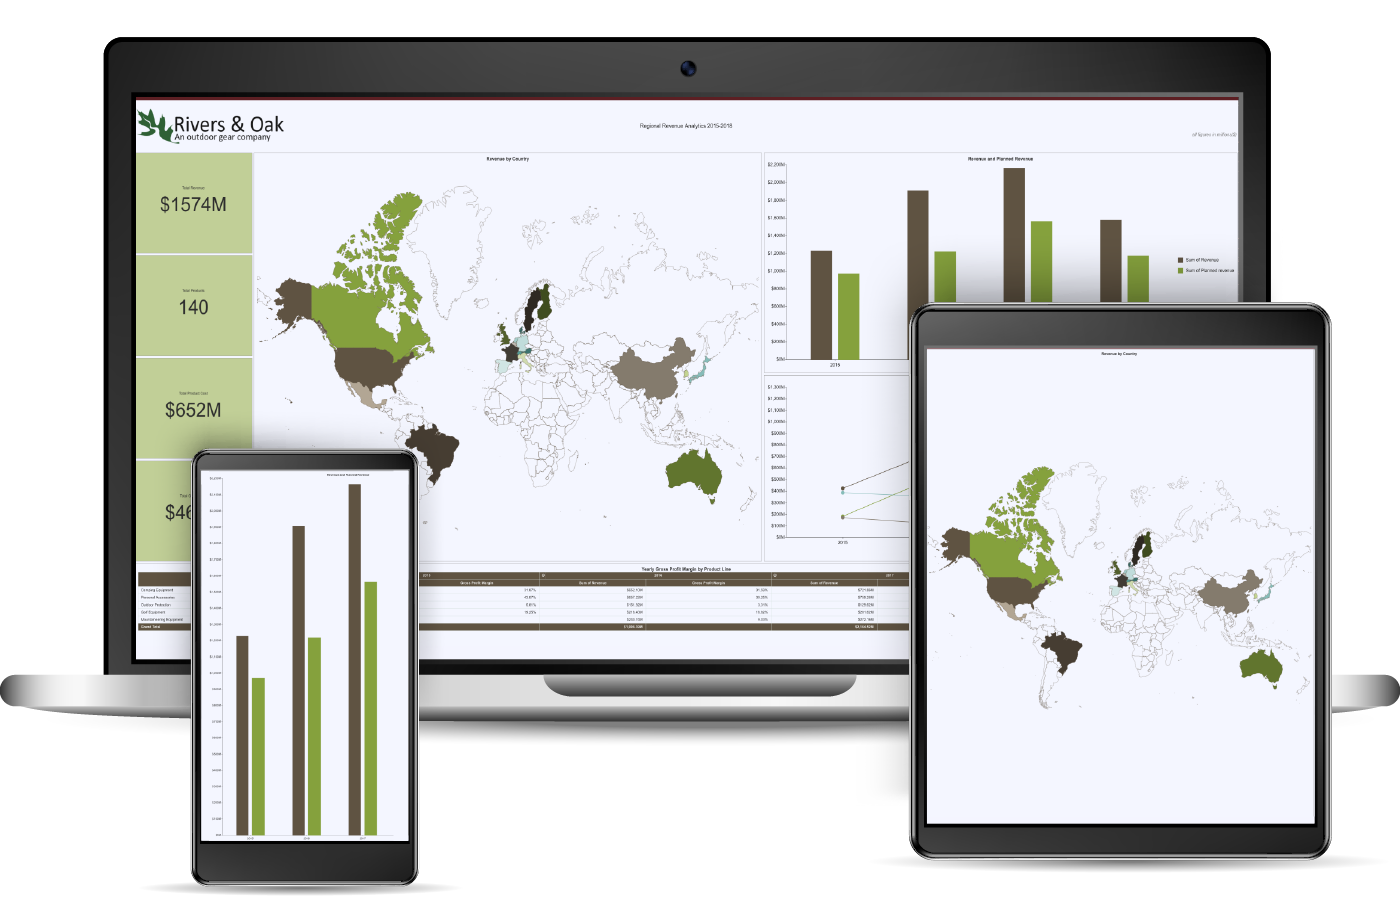
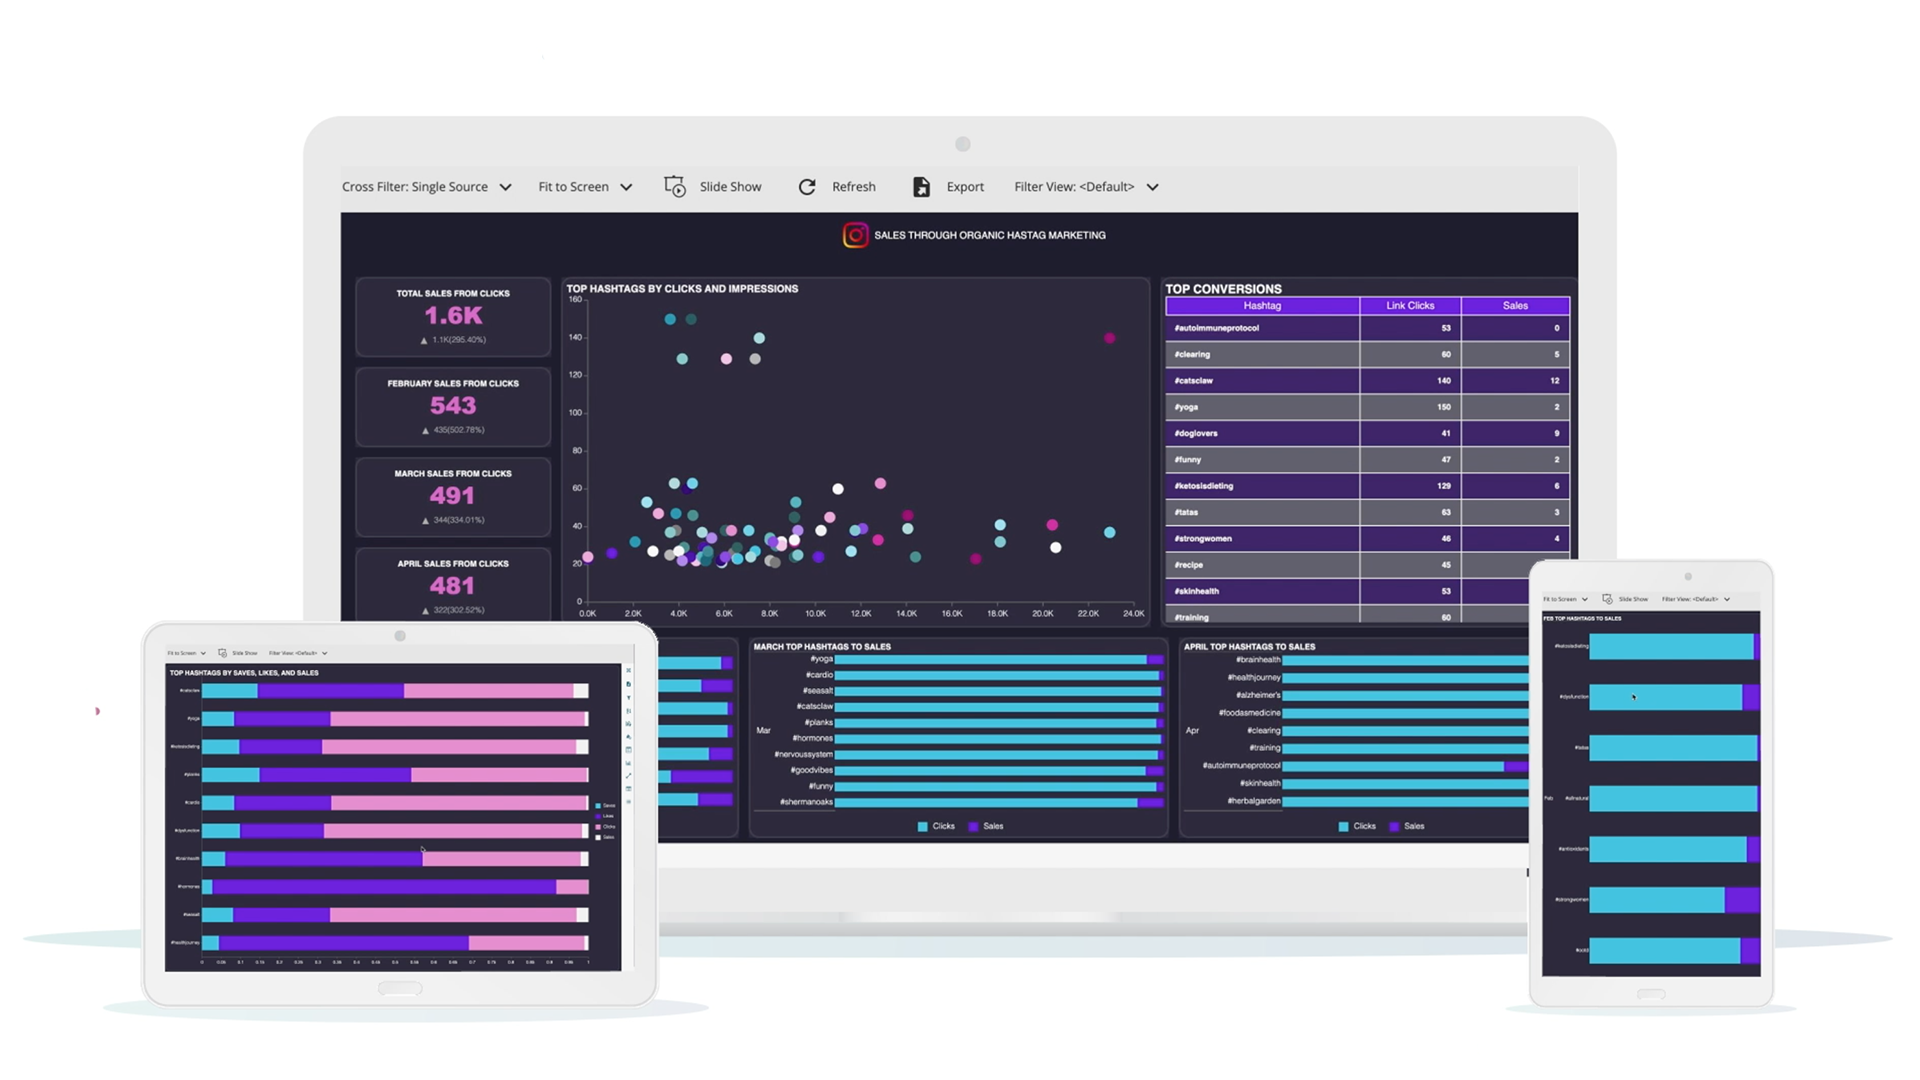
Interactive DashboardsCreate interactive BI dashboards with dynamic visuals.
-
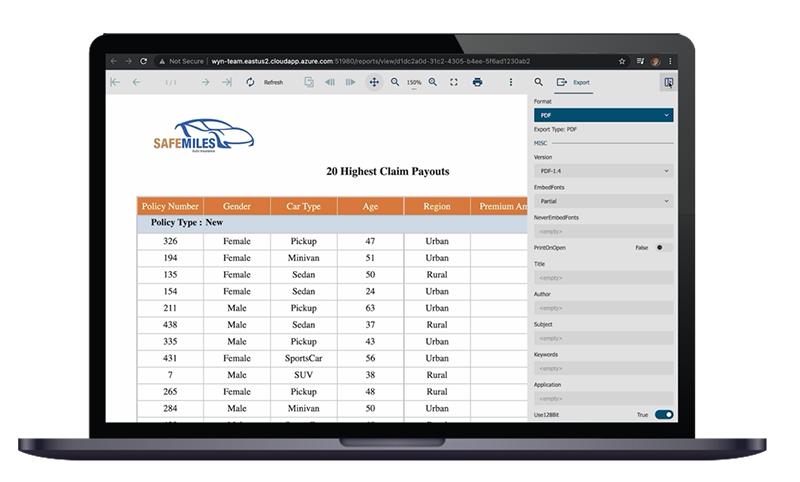
End-User BI ReportsCreate and deploy enterprise BI reports for use in any vertical.
-
Spreadsheet AnalyticsNewLast-Mile Analytics Tool.
-
Narrative Data StoriesThe Next Evolution of Data Storytelling
-
Automated Business DocumentsNewDocument Generation for Smarter Workflows
-
Visual Data Pipeline BuilderDesign Complex Data Flows, Simply.
-
Wyn ArchitectureA lightweight server offers flexible deployment.
Use Cases
Add On
Featured from Blog
-
 Wyn Enterprise 7.1 is ReleasedThis release emphasizes Wyn document embedding and enhanced analytical express...
 -
 Choosing an Embedded BI Solution for SaaS ProvidersAdding BI features to your applications will improve your products, better serve your customers, and more. But where to start? In this guide, we discuss the many options.
Resource Library
-
Visual GalleryInteractive sample dashboards and reports.
-
BlogExplore Wyn, BI trends, and more.
-
WebinarsDiscover live and on-demand webinars.
-
Customer SuccessVisualize operational efficiency and streamline manufacturing processes.
-
Knowledge BaseGet quick answers with articles and guides.
-
VideosVideo tutorials, trends and best practices.
-
WhitepapersDetailed reports on the latest trends in BI.
New Guide
-
 Choosing an Embedded BI Solution for SaaS ProvidersAdding BI features to your applications will impr...
 -

Business Intelligence


×